One of the most satisfying Phase 1 tasks is the moment when the airplane’s indicated speeds stop being guesses that feel plausible and start being numbers you can actually defend.
For N22UP, that happened on July 23 during the long calibration flight that turned a stack of test notes into confidence about the panel’s airspeed indication.
Why use the 4-leg GPS method
The idea behind the method is simple: if you fly the same indicated airspeed on multiple headings, the wind errors that distort any one leg can be solved out of the data. You are not trying to find a perfect no-wind day. You are trying to build a test that makes the wind cancel itself.
That is why the method is so useful in a Phase 1 environment. It does not require a miracle weather window. It requires discipline:
- Fly a stable indicated speed.
- Hold altitude and configuration consistently.
- Repeat the run on multiple headings.
- Do the math after the flying instead of improvising it in the cockpit.
The July 23 flight
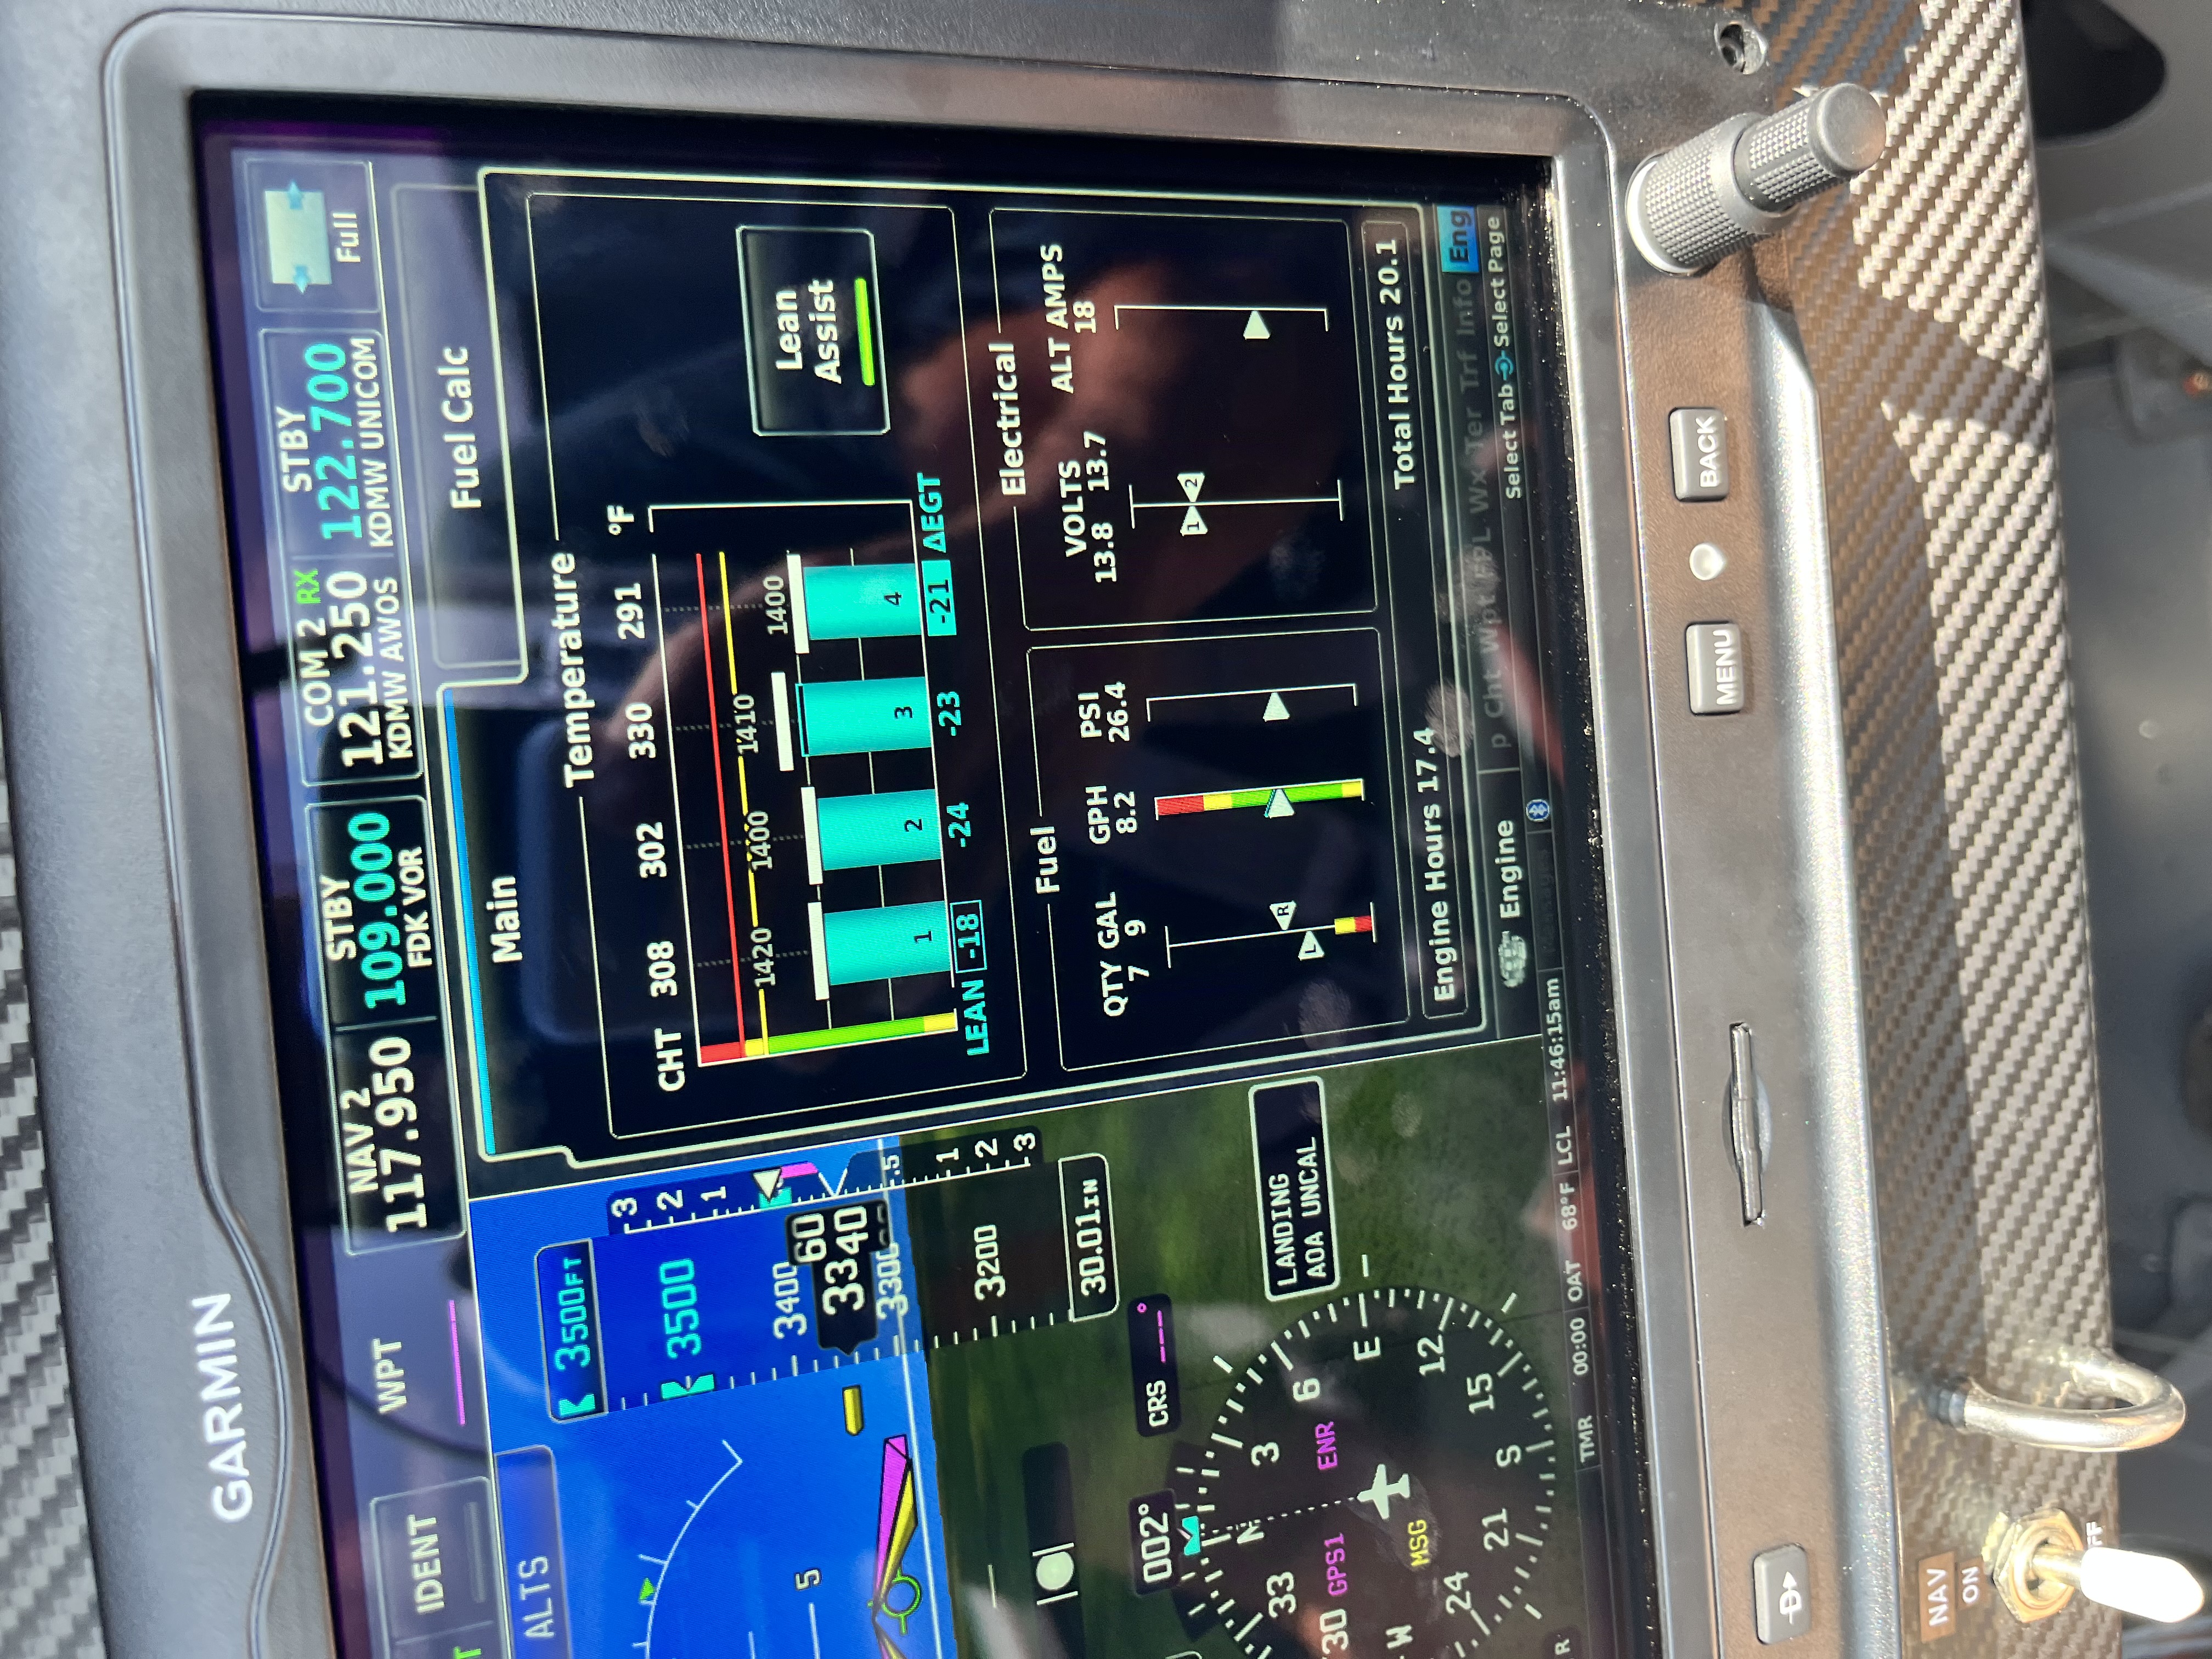
This was not a tiny local hop. The calibration work sat inside a longer day that included a warm-up sortie, a high-speed run, and then the longest data flight of the sequence: 2.31 hours, 19 gallons, and six landings at a range of speeds.
The point of the exercise was not to discover that RV-8s are fast. I already knew that. The point was to see whether the panel was telling the truth across the part of the envelope I actually cared about.
What the numbers showed
The useful headline from the analysis is that N22UP’s indicated airspeed looked good. The chronology summary of the calibration work shows the error staying in roughly the one-to-three-knot range across the tested points, which is comfortably good for the kind of flying this airplane was built to do.
That matters more than it might sound like at first glance.
If the indicated airspeed is trustworthy:
- Stall results become more meaningful.
- Approach-speed habits become more defensible.
- White-arc and green-arc decisions rest on better footing.
- The final operating-limits sheet feels like a measured document rather than an educated guess.
In other words, this was not just a panel-check exercise. It was a foundation post for the rest of the Phase 1 numbers.
Why this flight belongs in the Phase 1 spine
There are some Phase 1 tasks that feel dramatic in the cockpit and some that become dramatic only later, when you realize how many other decisions depended on them. Airspeed calibration is the second kind.
Nobody watching from the ground would have guessed that this was one of the most important flights of the test period. But the whole Phase 1 series gets stronger once the airplane’s airspeed indication is no longer a question mark.

What I would emphasize to another builder
The method matters as much as the result. The temptation in early test flying is to collect one quick number and move on. The better habit is to build a small repeatable process and trust that process more than your first impression.
That is really what July 23 gave me: not just a calibration result, but a defensible way to believe the result.
This post also sits right next to Stall Testing and the later capstone Phase 1 Complete: 40 Hours, 64 Days, 35 Flights, because those posts are stronger once the airspeed system itself has been checked.